
Essay Menu
The Math of Basic Chemistry - Topic Essay #1
CheMagic Virtual Molecular Model Kit
All actual activities in this chemistry series must be done with adult supervision!
Introduction - "Seeing" 8-Hydroxyquinoline
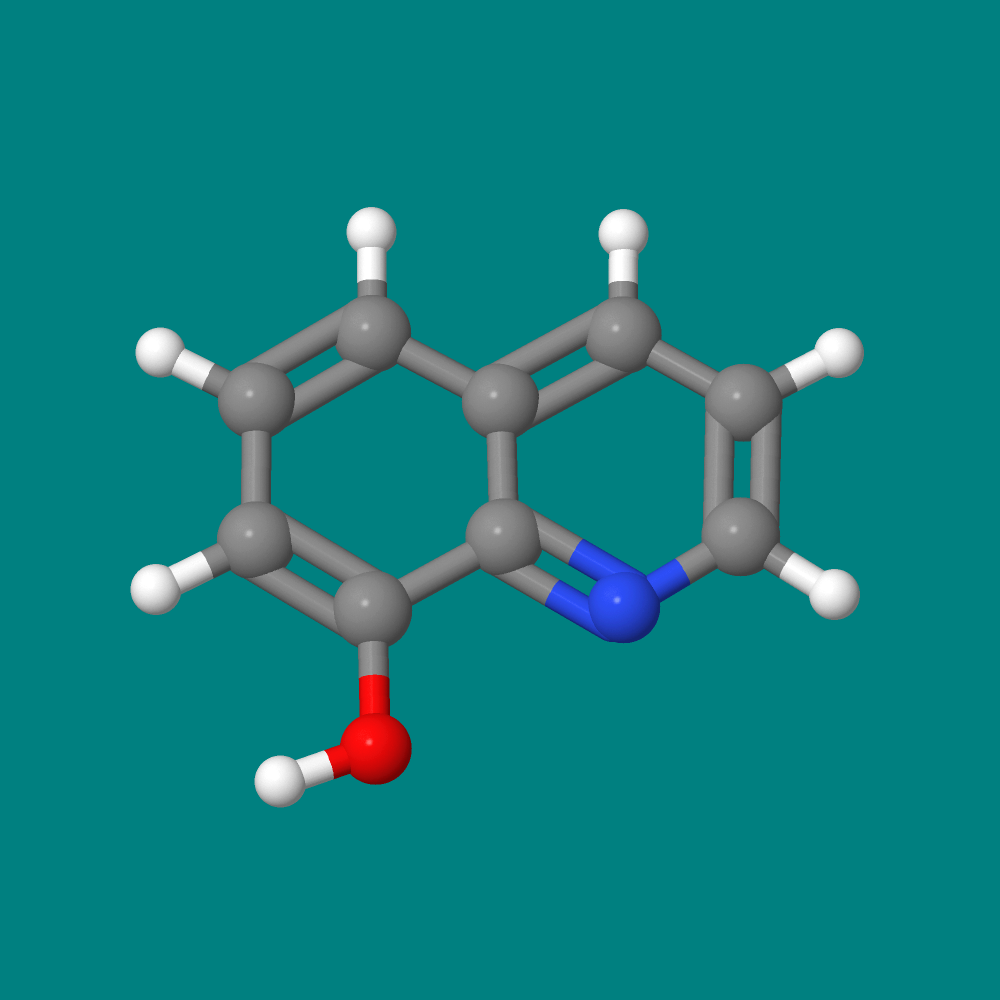
The featured molecular model image for this essay is 8-hydroxyquinoline. Although we cannot see small molecules with the naked eye, 8-hydroxyquinoline has been visualized with high-resolution atomic force microscopy (AFM). AFM was invented in 1985 by IBM scientists. Interestingly, the first scientist to visualize molecules scientifically was Sir Isaac Newton in 1687. How did he do that? One of the objectives of this essay series is to answer that question and to explore the basic nature of atoms and molecules, an exploration that is the essence of modern chemistry. This essay will focus on an intellectual tool that was used to "see" molecules in 1803 by the English chemist John Dalton. It is a tool that's still used in modern chemistry - direct proportion arithmetic, a tool for "seeing" what we cannot see with our naked eye.
A Word About Words
Putting quotes around the word "see" is going to get old very quickly! Therefore, in this essay, the word "see" will refer to what humans can see with their naked eyes or with their eyes and an optical microscope. The word "visualize" will refer to what humans can "see" (last time for see quotes, I promise!) with intellectual tools or technological tools other than an optical microscope. Let's apply these words to our featured molecule, 8-Hydroxyquinoline. All three images below are visualizations of the molecule 8-Hydroxyquinoline. Visualizations A & B are derived from intellectual tools, largely mathematical. Visualization C (credit: Science) was obtained by high-resolution atomic force microscopy (AFM). To be sure, AMF involves some pretty heavy mathematics! The key difference here is that visualization C comes to our eyes from the AFM instrument itself. As for visualizations A and B, they come via mathematical reasoning directly to the human brain. Caveat: There are macromolecules that humans can see with their naked eye. For example, some eye floaters that you see could be visible macromolecules. The visualizations A, B, and C, however, all have a powerful characteristic that an eye floater lacks. Each is a blueprint that summarizes an immense amount of useful chemical information. Learning chemistry involves learning how to read these blue prints.
(A) 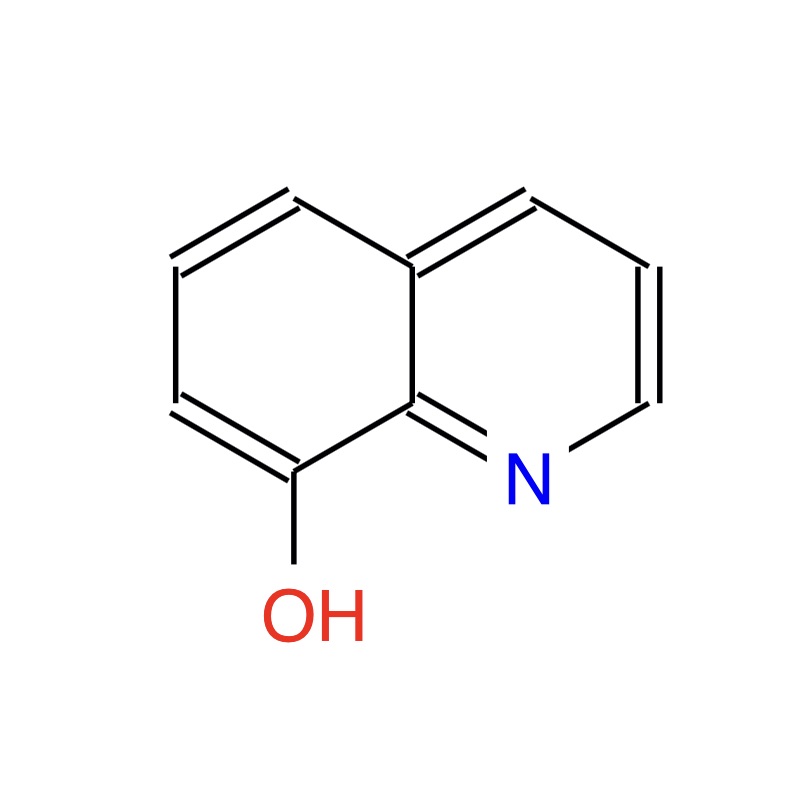 (B) (C)
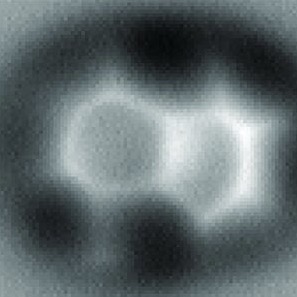
Reading Molecular Blueprints
The visualizations A, B, and C carry information that chemists can read. One type of information is the electrical charge distribution within the molecule. For example a chemist looking at blueprint A above could immediately tell you that there is an excess of negative electrical charge on the O (oxygen atom). All essays in this series have a link to the CheMagic Virtual Molecular model kit - blue link under essay title. This model kit tool can read visualizations A and B information. Just for fun, click the blue Model Kit link. It will load a model of 8-Hydroxyquinoline into the model kit window. Click/drag on the model window just to see that it is an actual model kit. In the lower left, click the MEP button. A MEP is a Map of Electrostatic Potential for the molecule - it's a charge distribution presented as a colored map. Working with the B blueprint (molecular model), the model kit has a mathematical algorithm to calculate the charge distribution as a colored surface map. This model kit demonstration is not intended as an explanation of MEPs. The demonstration is simply an example of the importance on molecular visualizations as useful blueprints. This essay series will include discussions of the math tools used by three famous scientists of the past who visualized molecules in important ways - John Dalton (1803), Sir Isaac Newton (1687), Daniel Bernoulli (1738). All of the math require for these visualizations is traditionally learned before 10th grade! This essay will focus on the math used by John Dalton. Only the math will be discussed. The actual visualization will be the subject of a future essay.
Math Used by John Dalton in 1803: Simple Direct Proportion Arithmetic
Image (D) below shows two pretty husband/wife coffee mugs. The image has two cups and two red hearts. Images (E) and (F) are hidden by cabinets hiding the cup images. Each cabinet holds an image identical to the image (D). If cabinets (E) and (F) are opened to reveal the cup images, how many individual red hearts will be visible on the page? This is not a trick question. Using arithmetic that is usually learned by 8th grade, the answer is six red hearts. This arithmetic, called direct proportion arithmetic, is what John Dalton used to visualize molecules.
(D)  (E)
(E)  (F)
(F)
In 1803, the English chemist John Dalton use simple direct proportion arithmetic to visualize atoms in molecules for the first time. His detailed reasoning will be the subject of a future essay. The subject of this current essay is to simply formalize the math of direct proportion reasoning. Direct proportion reasoning is appropriate when there is a numeric ratio that is a constant. In the case of the pretty cups image problem, the constant ratio is 2 Hearts per 1 Image. In the context of the problem wording, the following ratio is always a constant (Hearts/Images) that must equal 2/1 or simply 2:
| 2 Hearts | ||
| ------------ | = | CONSTANT |
| 1 Image |
This means that we can calculate the total number of hearts in any number of identical images by the following direct proportion equation (written for 3 Images). This is, off course, the arithmetic formalization of the intuitively obvious, but the formalization is useful where constant ratios are encountered in new and unusual situations:
| X Hearts | 2 Hearts | |
| --------------- | = | --------------- |
| 3 Images | 1 Image |
For the essay writer (moi), the rule for solving the above equation was part of 8th grade arithmetic: 1) cross multiply and equate the cross products; 2) divide by the coefficient of X; 3) Express the arithmetic canceling of units:
- (1 Image)(X Hearts ) = (3 Image)(2 Hearts )
- (X Hearts) = (3 Image)(2 Hearts)/(1 Image)
- X = 6 Hearts
Most chemistry textbooks use a shortcut to skip to step 2 in simple and complex (successive) direct proportion problems. This shortcut (dimensional analysis) focuses on the proper cancellation of units (hearts and images in this case), and it uses correct cancellation of the units to jump into the problem at step 2. In this series of essays, that will NOT be done. The natural logic of the problem is captured in step 1. For beginning chemistry students, understanding this natural logic is what is important. Speed of arithmetic computation via a shortcut can hide this natural logic.
A Simple Problem Using Direct Proportion
Farmer Jones feeds his cattle barley, but he knows that his cattle are picky eaters. They want some oats in their feed. Farmer Jones would like to keep the oat component of his feed as low as possible because the oats tend to make the feed less fattening. After a series of experiments, he found that 10.2 pounds of oats mixed with 39.8 pounds of barley was the ideal mix. He wants to conduct a multi day experiment with one animal, so he would like to make a larger supply of this barley/oat mix. If he starts with 20.4 pounds of oats, what weight of barley must he add to maintain the ideal mix that he discovered in his original experiment?
| 5.23 lb barley | 79.6 lb barley | 19.9 lb barley | 208 lb barley |
If you solved the above problem correctly, you are using exactly the math that John Dalton used to formulate his atomic/molecular theory. How John Dalton used this arithmetic to visualize molecules will be the subject of Topic Essay #3. Topic Essay #2 will examine the basic nature of scientific method.
The featured demo video for this page is a video that illustrates Boyles Law. In 1662, Robert Boyle reported experiments that showed that the absolute pressure exerted by a given mass of an ideal gas is inversely proportional to the volume it occupies if the temperature and amount of gas remain unchanged within a closed system. In mathematical terms, the relationship between gas pressue (P) and gas volume (V) is an inverse direct proportion: P1/V1 = P2/V2.
